Bitcoin price hits fresh high above $8200

Bitcoin’s price has broken the $8000 handle and posted a fresh high at $8226 on November 20, opening the door to a drift toward $10,000. A short-term buy zone lies around $8030 to $8060.
The short-term trading action shown below (15-min chart), shows that the market is looking to head to around $8030 to $8060 after posting a fresh high at $8226.00 during November 20. The green Ichimoku cloud, highlighted below, indicates a support zone which from around $8030 to $8060 for the later hours of November 20 rising to a height of $8120 to $8060. The Awesome Oscillator also indicates that momentum will switch with a swing to the downside. Notice the twin peaks in the indicator and the fact that the color has turned red in the past two 15-min trading sessions. As the Oscillator swings back to zero, the market price should follow in a similar fashion toward the Ichimoku cloud.
The psychological $8000 is another important area of interest, serving as support.
Alternatively, the market may hold above the conversion line (blue) which lies around $8168. We could just place limit buy orders just above the high at $8226 to get in on the ongoing uptrend.
The 2-hour chart shows a much more bullish picture, with $8172.79 an important balance point. Notice, in the most recent 2-hour trading session we have seen the Bullish Saucer signal being triggered, which suggests there is a high likelihood that BTC-USD will hit $8342.18 in the upcoming trading sessions this week. Using the Fibonacci tool for the fractals on the move to the previous all-time high at $8087.35, the Fibonacci extension levels project resistances at $8342.18 and $8754.53, as well as more further up including $9166.88.
Immediate support is provided at the fractal resistance turned support at $8087.35, as well as $7990.04.
The 2-hour chart is again shown below, but with the Ichimoku indicator instead. The conversion line (blue), base line (red) and cloud are all pointing upward, suggesting a move higher in the sessions ahead. However, the cloud is becoming thin and looks like it could change color (to red), which will give the first indication of a downward move. The horizontal portion of the lower span lies at $7604.50, signaling an important support at $7604.
The most recent fractals lie at $8087.35 and $7900.00, with the market breaking the fractal resistance in recent trading sessions. However, notice the divergence in price and the Awesome Oscillator; with price making higher highs, the oscillator is not following this pattern, which means that we should see the price cool down and revisit the fractal levels mentioned earlier.
Over the long-term, the price of bitcoin looks looks to reach toward $10,076.44, the second Fibonacci extension level. Notice how the market structure has respected the Fibonacci ratios displayed below. For instance, once the market reached $6926.54 in early November, a fractal support was formed at $6922, before the big drop to $5555. With a daily close above $6926.54 on November 15, the expected range in BTC-USD is now between $6926.54 and $10,076.44, the immediate Fibonacci levels. The Bullish Saucer was signaled on November 17 with a breach of $7976.79 and we expect the bullish momentum remain dominant if the market remains above this level.
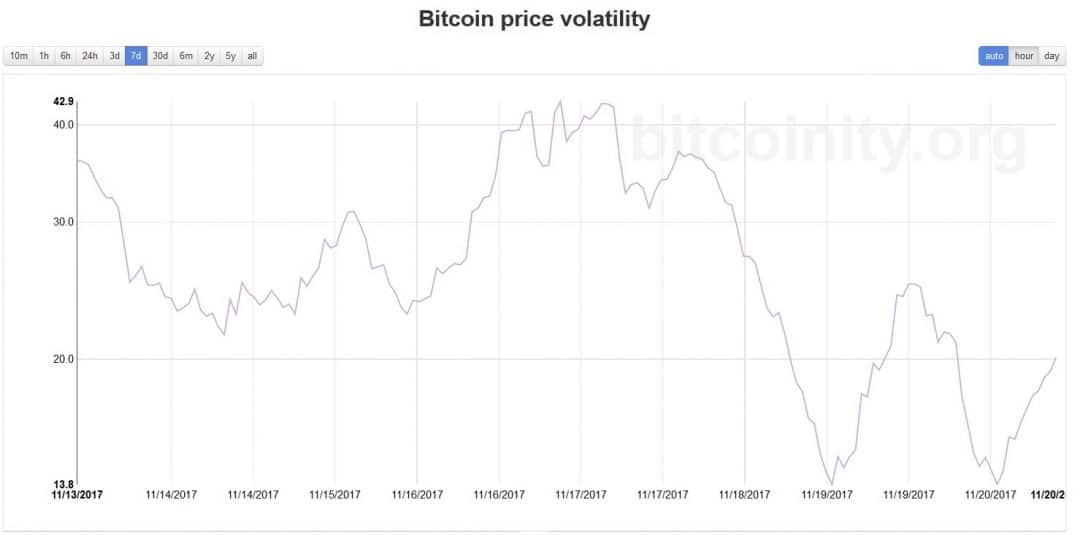
Looking the chart below, we see that the volatility in the price of Bitcoin is likely to increase over the coming days, after settling down somewhat from the large fluctuations of more than $1000 during early November. Over the past seven days, the measure reached a low around 13.8, but now looks to increase above 20.
Source:https://btcmanager.com/bitcoin-price-hits-fresh-high-8200/


No comments:
Post a Comment